《Python编程 从入门到实践》第二部分阅读笔记:可视化
第二部分 项目
项目1 外星人入侵
第12章 设计飞船
第13章 设计外星人
第14章 记录分数
项目2 数据可视化——matplotlib
第15章 生成数据
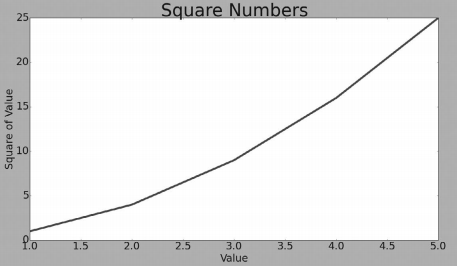
绘制折线图
代码:
1
2
3
4
5
6
7
8
9
10
11
import matplotlib.pyplot as plt
squares = [1, 4, 9, 16, 25]
input_values = [1, 2, 3, 4, 5]
plt.plot(input_values, squares, linewidth=5) # input_values为输入(x轴),squares为对应坐标的输出,linewidth决定plot()绘制线条的粗细
plt.title("Square Numbers", fontsize=24)
plt.xlabel("Value", fontsize=14)
plt.ylabel("Square of Value", fontsize=14)
# 设置刻度标记的大小
plt.tick_params(axis='both', labelsize=14) # 实参将影响x轴和y轴上的刻度(axes='both')
plt.show()结果:
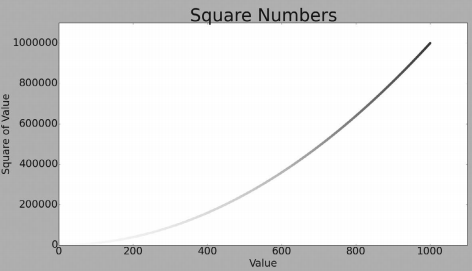
绘制散点图
代码:
1
2
3
4
5
6
7
8
9
10
11
12
import matplotlib.pyplot as plt
x_values = [1, 2, 3, 4, 5]
y_values = [1, 4, 9, 16, 25]
plt.scatter(x_values, y_values, c=y_values, cmap=plt.cm.Blues, edgecolor='none', s=40) # s:点的大小 c:点的颜色,也可设置为一个包含三个0-1的小数元组代表红绿蓝颜色分量 alpha:设置透明度,0为透明,1为完全不透明 cmap:从起始颜色渐变到结束颜色。这里根据每个点的y值设置颜色
plt.title("Square Numbers", fontsize=24)
plt.xlabel("Value", fontsize=14)
plt.ylabel("Square of Value", fontsize=14)
# 设置刻度标记的大小
plt.tick_params(axis='both', which='major', labelsize=14) # which,值为 ‘major’、’minor’、’both’,分别代表设置主刻度线、副刻度线以及同时设置
plt.show()
plt.savefig('squares_plot.png', bbox_inches='tight') # 第二个实参指定将图表多余的空白区域裁剪掉结果:
其他:
隐藏坐标轴
1
2plt.axes().get_xaxis().set_visible(False)
plt.axes().get_yaxis().set_visible(False)设置窗口尺寸
1
plt.figure(figsize=(10, 6)) # figure()用于指定图表的宽度、高度、分辨率和背景色;形参dpi向figure()传递该分辨率
填充区域颜色
1
plt.fill_between(dates, highs, lows, facecolor='blue', alpha=0.1) # 传入x值序列(dates)和两个y值序列(highs、lows),facecolor指定填充区域的颜色,alpha设置透明度,同上
第16章 下载数据
csv模块数据作为一系列以逗号分隔的值写入文件
读入:
1
2
3
4
5
6
7
8
import csv
filename = 'sitka_weather_07-2014.csv'
with open(filename) as f:
reader = csv.reader(f) # 创建与文件关联的阅读器对象
header_row = next(reader) # next():传入阅读器对象,返回文件下一行;此时返回的是文件第一行
for index, column_header in enumerate(header_row):
print(index, column_header)
print(header_row)
第17章 使用API
Web API
获取Github的响应,代码:
1
2
3
4
5
6
import requests
# 执行API调用并存储响应
url = 'https://api.github.com/search/repositories?q=language:python&sort=stars'
r = requests.get(url) # 获得响应对象,包含一个status_code属性,状态码为200表示请求成功
# 将API响应存储在一个变量中
response_dict = r.json() # 将信息转换为一个字典